This example creates a data graph by the usage of regular data. You can find the data in the file setuppath\ samples\data\regular.txt, here setuppath is the setup path of Visual Data Pro in your computer, for example, c:\program files\Visual Data Pro. 1. Click 2. Click Import Data ... item from File menu to import data from the file setuppath\ samples\data\regular.txt. The size of the data is 41*29. You can see them in Data Edittor.
3. Click
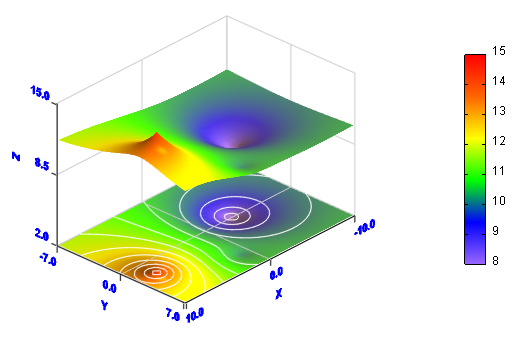
4. Click OK button to create the graph.
|
||
Download Visual Data today and start creating stunning scientific visualizations for your research and analysis.

 button.
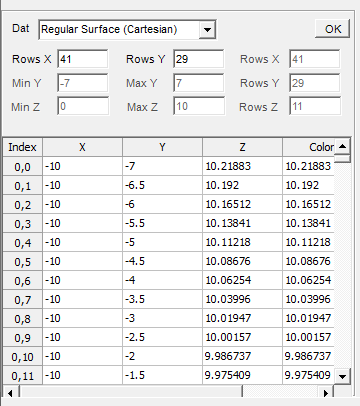
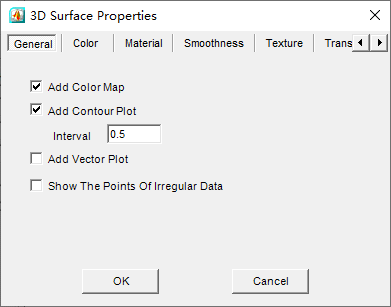
 button in Standard toolbar to open 3D Surface Properties dialogbox. Check Add Color Map checkbox and Add Contour Plot checkbox, input 0.5 in Interval textbox.